The Rounding Bottom chart pattern analysis is usually conducted on a weekly chart. This is because this pattern is associated with a longer period of consolidation. Rounding bottoms start out with the bias to the down side but then as the trend is established and the pattern develops it turns its bias to the long side.
You can identify the Rounding Bottom pattern when doing your chart analysis with its saucer shaped bottom which is formed slightly less aggressive than other bottoming reversal patterns.
Powerful Reversal Pattern
The pattern does not vary too much in its development but can sometimes be mistaken at first as having similar characteristics as the Inverted Head and Shoulders. The difference arises with its saucer shaped bottom which develops over a longer term stopping it from becoming a V pivot (Bottom).
Support areas of the Rounding Bottoms are often harder to pin point from a chart analysis's point of view as like a V pivot you only get one reference point to mark as support.
Key Points in Formation:
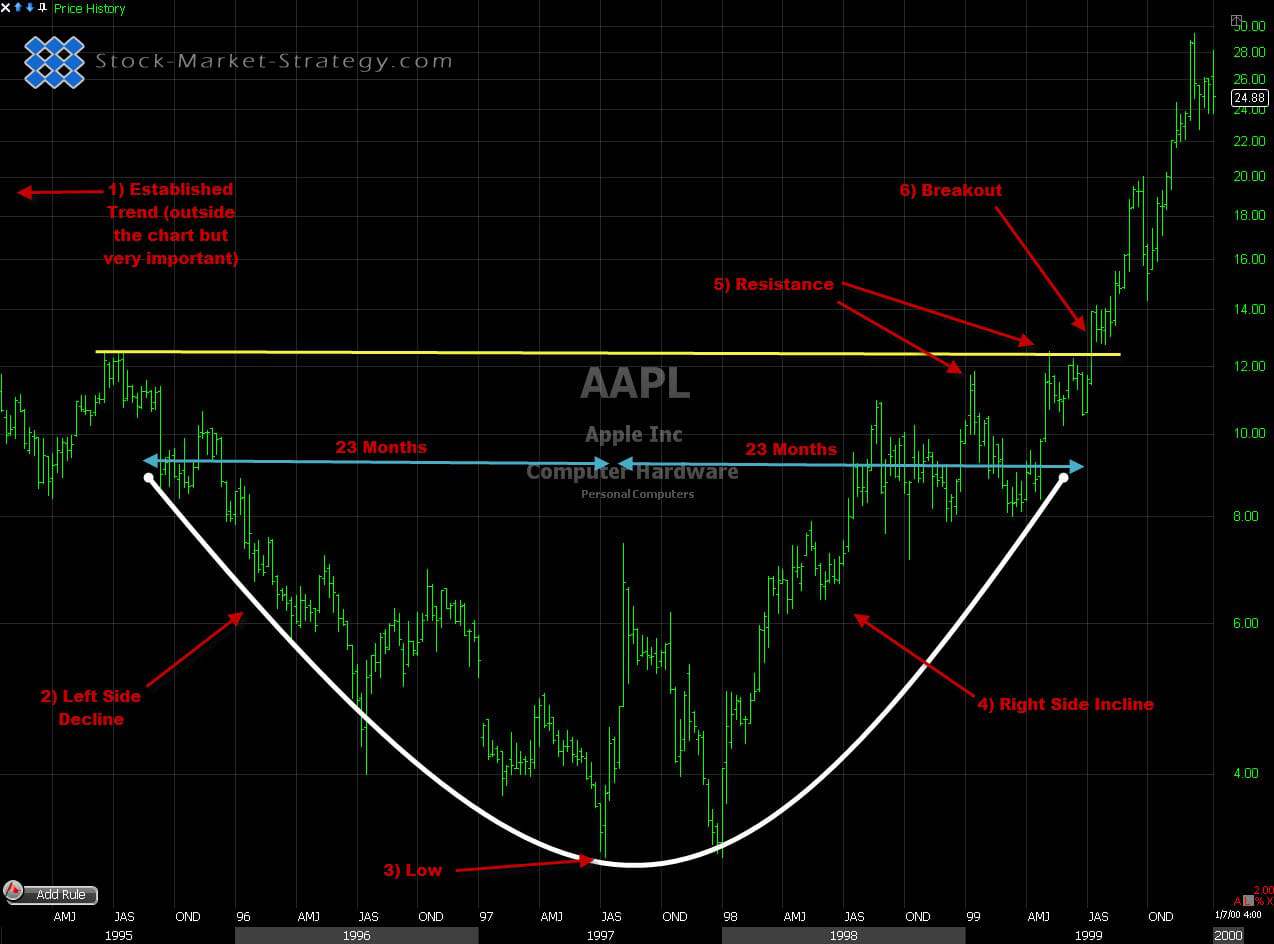
- Establish Trend - like any other reversal pattern there must be a long term established trend to reverse. Rounding Bottoms have to be formed after a significant long term down trend.
- Left Side Decline - This decline is the first part of the price move and it has a tendency to be slightly volatile with multiple lower highs and lower lows. This is where the confusion can firstly begin of whether it is an Inverted Head and shoulder.
- Low - After you have seen the progressive left decline, the low of the Rounding Bottom will start to be formed. This will be over a number of weeks so it does not appear to be a V pivot (bottom). This is what I deem to be the first confirmation of the Rounding Bottom Pattern.
- Right Side Incline - For the incline to be confirmed it has to follow about the same time frame as what the left side decline took to fall to the low. As mentioned above if the incline is too steep the pattern may be in question.
- Resistance - Analysing chart pattern resistance is all about looking to the left. The Rounding Bottom is no different and you can get your first major area of resistance plotted where left side decline starts which will be last major lower pivot high. On fig.1 we draw our resistance trend line horizontal from that point to where price action will meet from the right side incline.
- Breakout - This is the confirmation that price action will continue to the upside breaking the last major lower high pivot which is our resistance trendline. Confirmation still needs to be that the price closes outside the resistance area. You can often see price returning to test the resistance trendline but it does not necessarily have to.

Powerful reveral pattern
Styles Traded - How can it be Traded:
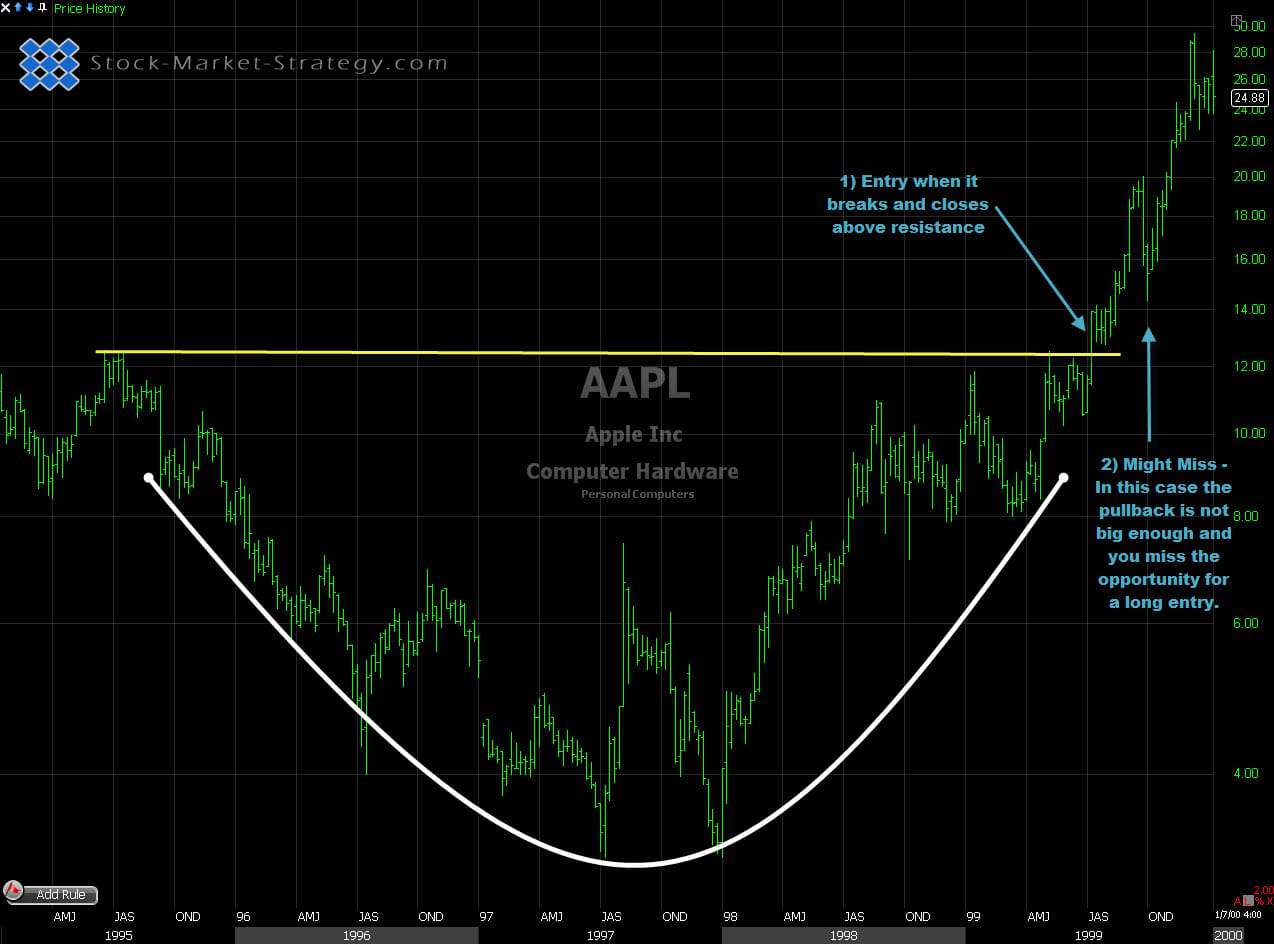
- Entry - Price breaks resistance area and closes above. This has a bigger stop loss but is more confirmation that it's on its way down.
- Might Miss - Price retests the resistance trendline which now becomes support area.

How to trade the Rounding Bottom
Both trading style entries have their strength and weaknesses and will come down to the trading style of the individual trader and their tolerance to money management (R&R).
