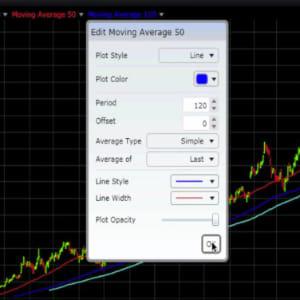
One of the most popular tools in trading, Moving Averages, have existed since the beginning of technical analysis. They are easily calculated (before automated charting packages) which is a key factor in its popularity. It smoothes out the data making it easier to spot the trend. It also helps filtering out "noise" in volatile markets.
They are mostly calculated by using the "closing price" of the bar but it is also possible to calculate it by using "opening price or high-low price" This bar could be a tick bar, minute bar, daily bar and so forth. In the early days people only used daily charts, therefore many people refer to the MAs indicators as daily MAs. Since the introduction of intraday trading people are now referring to MAs as period value MAs, e.g. 20 period MA.
Learn to Understand How and When to Use This Techincal Analysis Strategy
MAs indicators work as dynamic support/resistance. Traders often keep an eye on these MAs which partly results in self-prophecy.
Simple Moving Average (SMA) and Exponential Moving Average (EMA) are the most common MA and are described beneath.
Simple Moving Average (SMA)
A SMA is created by calculating the average price of a stock over a certain amount of bars/periods. So a 20 SMA on a 5 min intraday chart shows the average price for the last 20 5 min bars.
Exponential Moving Average (EMA)
One of the problems with SMA is that it is lagging the price. The EMA challenge this problem by putting more weight on the recent bars price. The EMA then adapt faster to the current rally or drop giving the trader a heads up.
Which kind of MA to use and which length?
This is a personal preference of the trader. Personally I recommend using SMA for analysis and EMA for entry signals. SMA is, in my opinion, the best to filter out noise and helps me keep focused on the trend.
The EMA will give me a faster entry signal on an EMA crossover or a bar-close over/under EMA.
The length is something a trader needs to test to see which length gives the best results in case of trend determination and entry signals.
Tips and Ideas
Moving Averages indicators can be used for 4 things: Trend, Value, Entry and Stoploss.
1. Trend - MAs are a great tool for helping you to determine the trend of a stock, future etc.
a. The slope of the MA determine the trend
b. Where the price action is compared to the MA e.g. over or under.
c. When using multiple MAs you can determine the trend by having a short MA and a long MA and then whenever the short MA is under the longer term MA then the trend is down and vice versa.
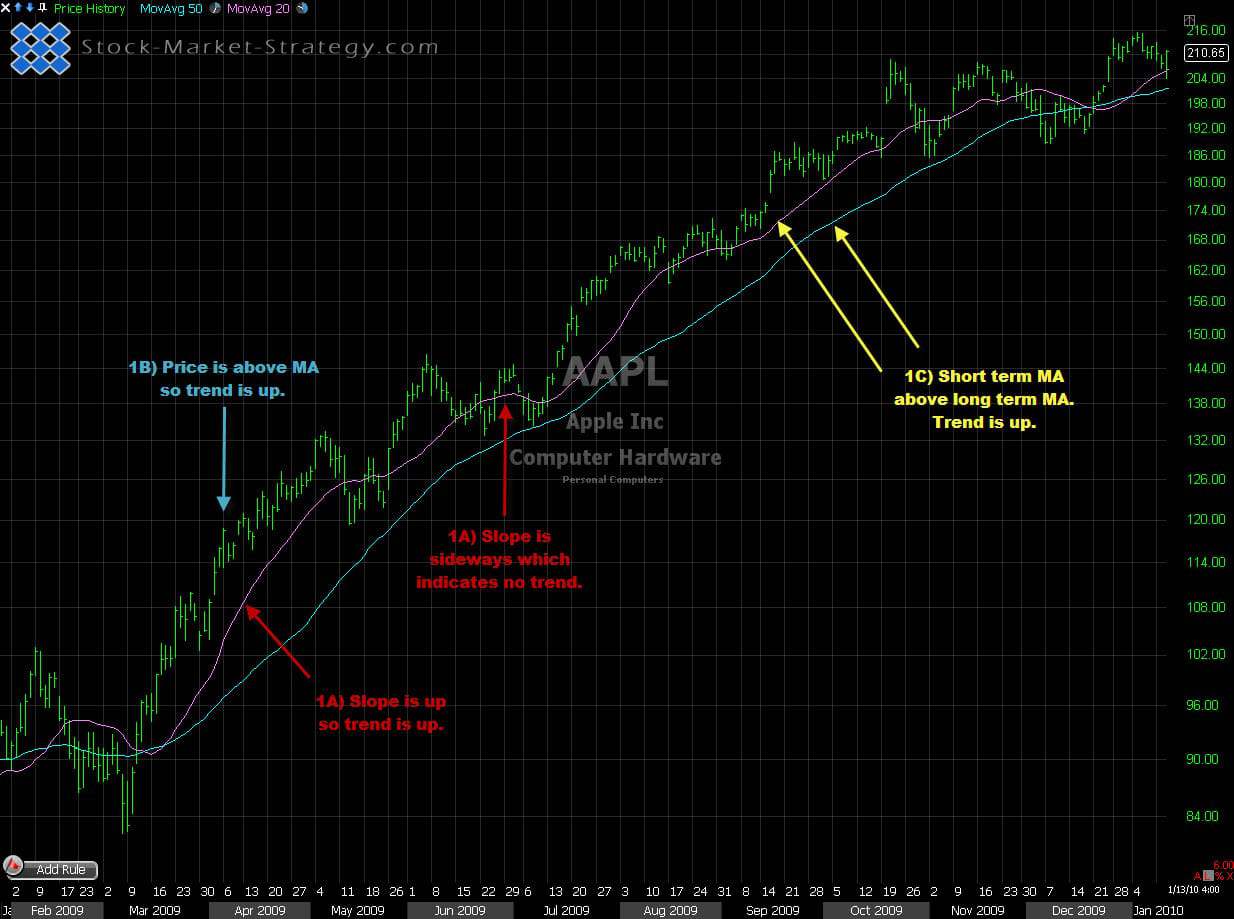
Using 2 Moving Averages to determine the trend
2. Value - Whenever the price is near the MA it will have a "fair" value and could be a place to initiate a position in the stock, future etc. Of course the word "fair" has to be taken as a lose term. But after a rally and the price pulls back to the MA you could imagine that this is the average price the last buyers has bought at and therefore seems "fair".
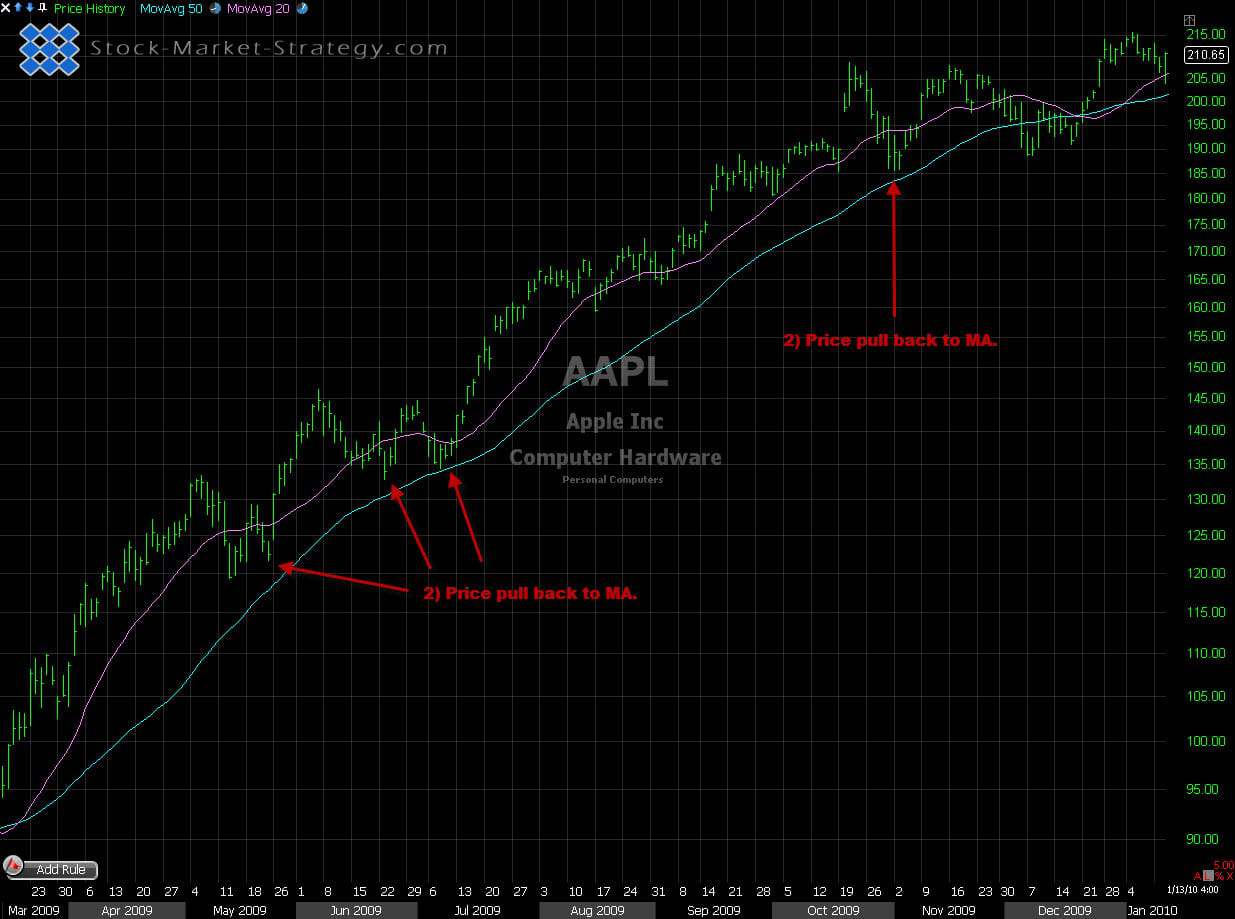
Using Moving Averages to trade the pullback
3. Entry - Many traders use MAs for entry and this can be done on several different ways.
a. Crossover of two MAs (preferable a very short term MA such as 9 Period and a intermediate MA such as a 20 Period.
b. A close above/under MA
c. A limit order at the MA
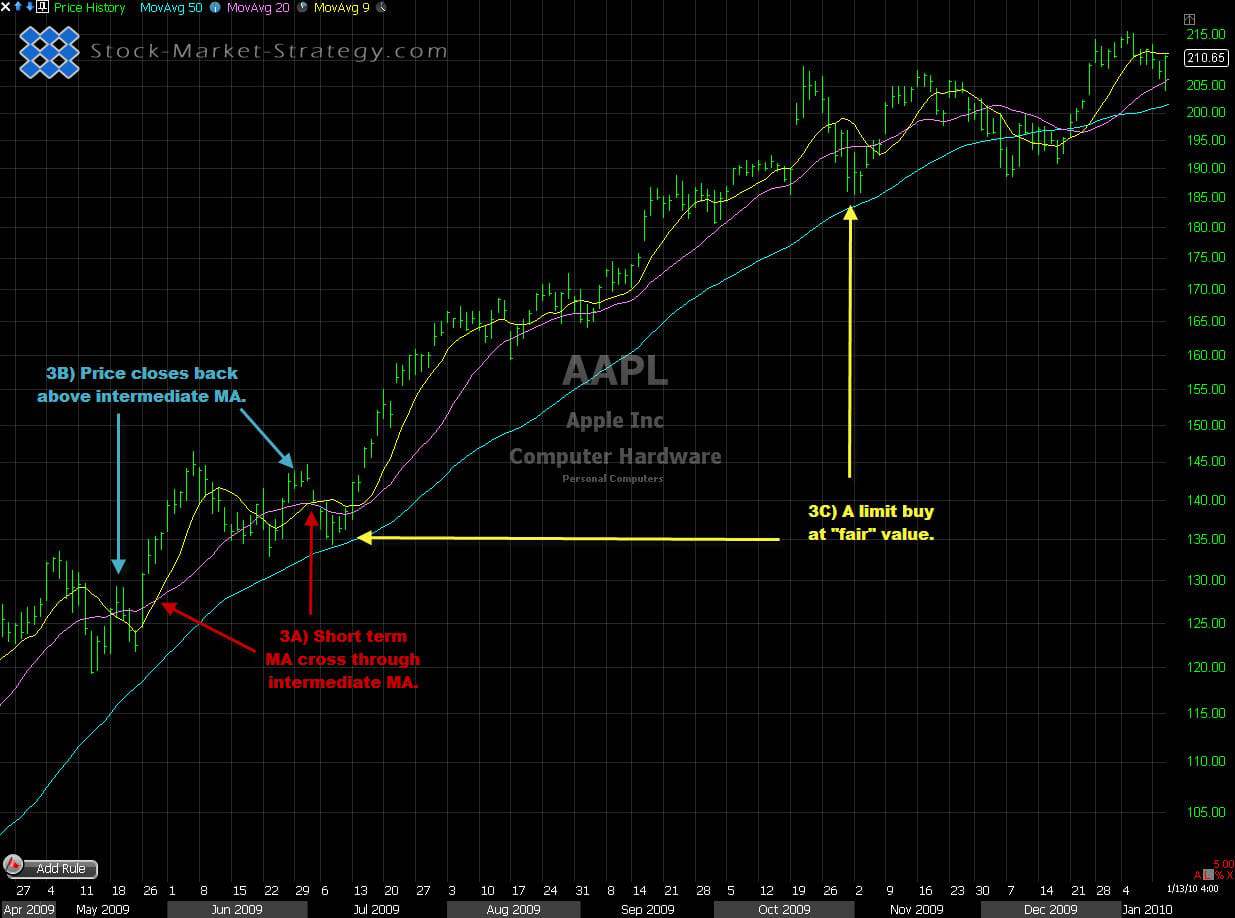
Ways to use Moving Averages for entering a trade
4. Stoploss- MAs is also very good at using as stoploss and trailing stoploss. This is when the MA acts as dynamic support/resistance. A close above/under the MA will trigger the stoploss/trailing loss.
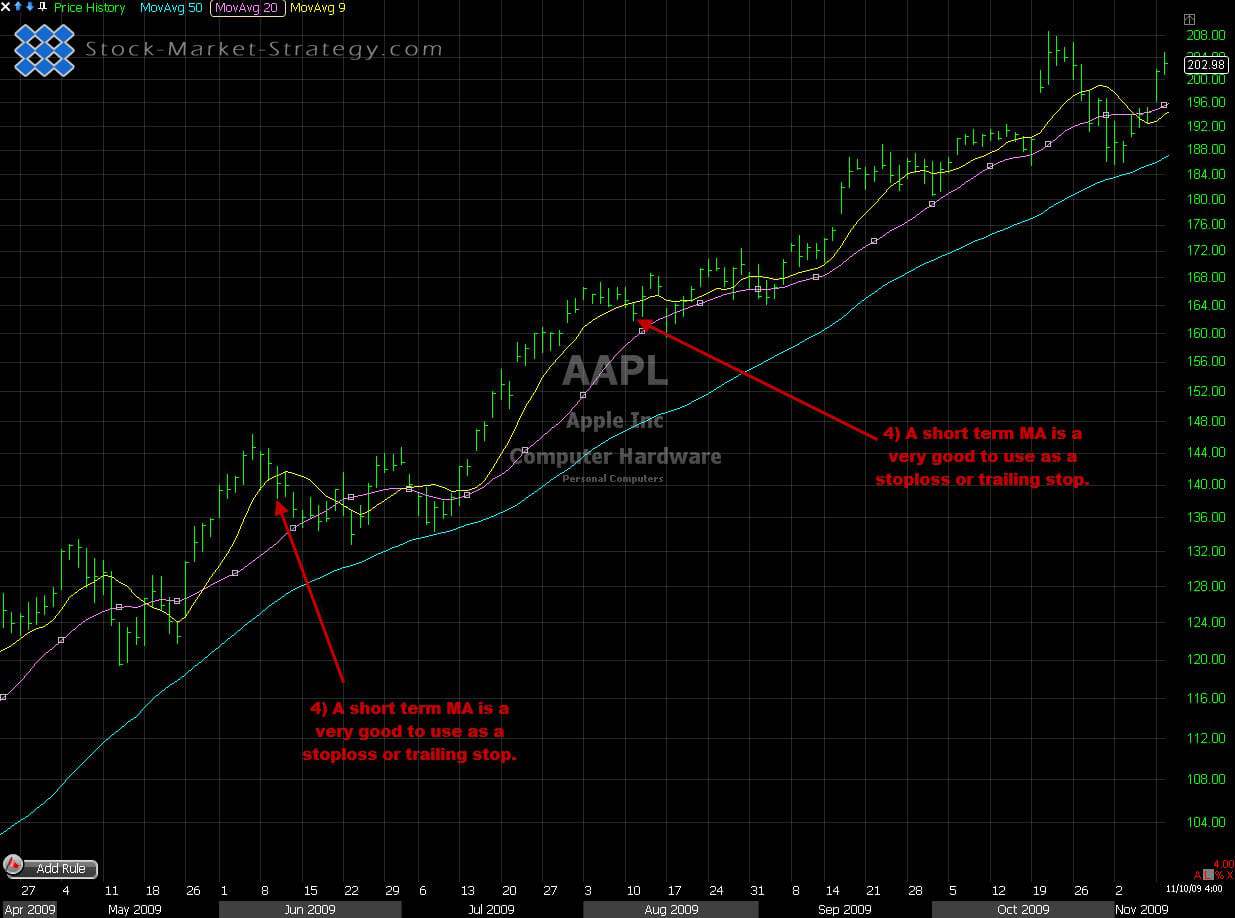
Using Moving Averages for stop losses
Our Implementation
MAs are a great tool when combining it with other indicators. An idea would be using MAs to determine the trend and then using an oscillator to pinpoint the entries on pullbacks. MAs are also an excellent add-on to chart-pattern traders. I personally prefer continuation patterns above/below my x period Moving Average. This helps me to only trade the "real patterns" as continuation patterns "demand" a trend prior to the pattern.
