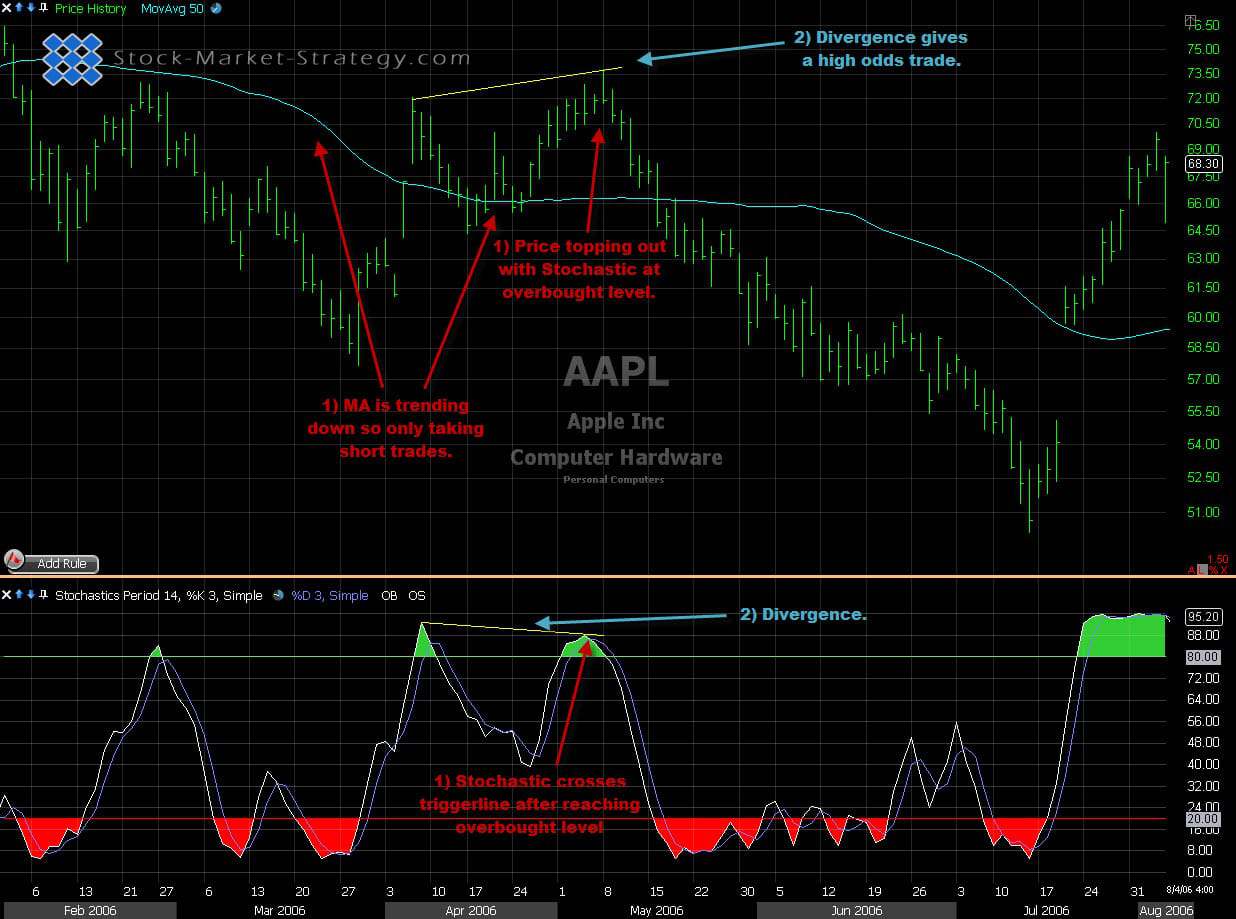
Stochastic was invented by George C. Lane more than 50 years ago. Needless to say, the reason for it still being around today is the popularity of this tool. Stochastic is a momentum indicator which tells us how strong or weak the current close is compared to the previous high/low over a set number of bars. So, if the close is consistently at the high range (rising stochastic) we are experiencing buying and if we are seeing consistent closes at the low range (falling stochastic) we are experiencing selling.
This Indicator Identifies Overbought and Oversold Signals
The default settings for Stochastic is a 14 period called %K with a 3 simple Moving Average to smoothing it out. A trigger line of the smoothed %K is plotted to give the trade signals. This trigger line which is called %D is a simple moving average and the most common period is 3. When Stochastic is plotted on the chart the setting will then be written like 14,3,3 - which is the length of Stochastic, the smoothing factor and the trigger line respectively. Of course, the settings are entirely up to the trader. Traders looking for scalps might use a 7,3,3 setting and traders looking for position trading might look at a 21,10,4 setting. Like with all indicators, the lower the settings the more whipsaws.
When Stochastic meaning %K is above the trigger line %D, then the momentum is to the upside however brief it may be. When Stochastic is under the %D then the momentum is to the downside. The entry signal occurs when Stochastic %K crosses trigger line %D on a close basis and not intrabar.
Many traders believe that overbought and oversold is the main use of Stochastic. So if Stochastic is above 80, many traders look to go short and when it is under 20 many traders look to go long. However this was not George Lane's idea with the Stochastic as the Stochastic can stay overbought or oversold for a long time so be careful not to go long/short at these levels. However he did believe that the best signals come after hitting these extreme levels. He believed then there were room for bigger moves.
Tips and ideas
We now know what Stochastic tells us and when the entry signal appears but can we do better than that?
1. A good idea is to add, for example, a longer term moving average to determine the trend. Then you only want to take the trades signaled by the Stochastic crossover of the trigger line which is with the longer term trend. If you want to filter out even more trades and only focus on the stronger signals then only take the trades after Stochastic has hit the extreme levels of 80 or 20.
2. Another good idea to improve the quality of the signal is by using divergence when entering the trade. When going long then look for stochastic to make a higher low after price makes a new low. This shows that the new low in price is not supported by the momentum. This can signal a fast bounce and thereby a stronger crossover signal.

Stochastic Indictor - Buy the highs and sell the lows
Our Implementation
Stochastic is one my favorite indicators but only because I use it to its full capacity, such as extreme readings and divergence. I also like to look at the price action to the left to make sure I only go with the trend. If we are in a range I prefer to use a lower setting in order to get in quicker and if we are trending I like to use a higher setting in order to get the bigger pullbacks and ignore the smaller ones.
